For restaurant operators, data is everywhere—but actionable insights? Those are harder to come by. You know your kiosks are processing orders, but do you know which locations are outperforming others? Which hours see the highest volume? How much revenue are you leaving on the table with low loyalty engagement?
That’s the challenge Bite set out to solve with our newest feature: the Sales & Analytics Dashboard, now available to all Bite Admin users.
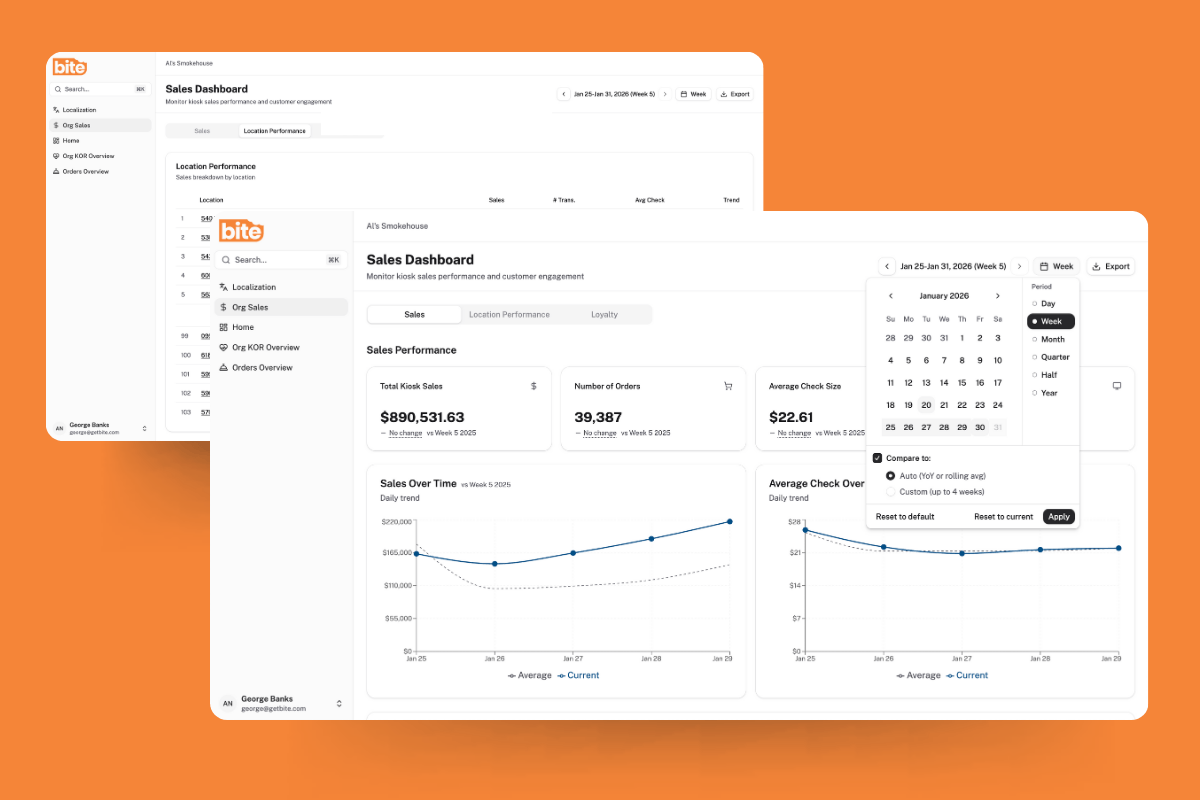
Beyond Order Counts: What the Dashboard Actually Shows You
The Sales & Analytics Dashboard consolidates your kiosk performance data into a single, intuitive view. Instead of piecing together reports from multiple sources or relying on gut instinct, operators can now access real-time insights across their entire organization.
Here’s what you can track:

Sales Performance Across Your Footprint
View total sales, average check sizes, and order volume across all kiosk-enabled locations. Filter by specific date ranges to analyze performance during promotions, seasonal peaks, or new menu rollouts. Compare current performance against any historical period to spot trends and measure growth.

Location-Level Insights
Not all locations perform equally—and that’s valuable information. The dashboard makes it easy to identify your top performers and understand what’s working, while flagging underperforming locations that may need operational attention, menu adjustments, or additional staff training.

Hour-by-Hour Order Trends
Labor costs are one of the biggest line items for any restaurant. The dashboard breaks down order volume by hour, giving you the data you need to optimize staffing levels. See exactly when your kiosks are busiest, and schedule accordingly to improve service speed without overstaffing during slower periods.

Loyalty Program Performance
For brands leveraging loyalty programs through their kiosks, the dashboard provides critical metrics, including loyalty penetration rates (what percentage of orders include loyalty sign-ins), average check uplift from loyalty members, and revenue opportunity forecasting based on increasing loyalty adoption. This helps you quantify the ROI of your loyalty program and identify opportunities to drive enrollment.
Designed for How Operators Actually Work
The dashboard was built with flexibility in mind. Customizable date ranges let you analyze any time period—yesterday’s lunch rush, last month’s performance, or year-over-year comparisons. Location filters allow multi-unit operators to drill down into specific markets, franchisee groups, or individual stores.
Whether you’re a single-location owner checking daily performance or a corporate team managing hundreds of kiosks nationwide, the interface adapts to your needs.
What’s Coming Next
The current release focuses on kiosk channel analytics, but Bite’s product team is already working on expanded capabilities:
- Web and mobile ordering analytics to give you a complete picture across all digital channels
- Kiosk usage funnel analysis to understand where guests drop off in the ordering process and optimize the user experience
- Menu performance insights to identify top-selling items, underperforming SKUs, and upsell opportunities
Why This Matters Now
The restaurant technology landscape has evolved beyond simply automating transactions. Today’s operators need tools that help them understand their business, not just run it.
Kiosks generate thousands of data points every day—customer preferences, ordering patterns, peak times, promotional effectiveness. Without the right analytics tools, that data sits unused. With the Sales and Analytics Dashboard, Bite customers can transform that information into decisions that drive revenue, reduce costs, and improve the guest experience.
Getting Started
The Sales and Analytics Dashboard is now live for all Bite Admin users. To access it:
- Log in to your organization’s Bite Admin account
- Navigate to “Org Sales” in the main menu
- Start exploring your data
Questions about the Sales and Analytics Dashboard, or want to learn more about how Bite’s intelligent kiosk platform can grow your business? Contact our team or reach out to your Customer Success Manager.


