For most QSR and fast casual franchise systems, the decision to implement kiosks is made well above the operator level. Corporate selects the hardware, negotiates the vendor agreement, architects the menu, and communicates the brand standard. The franchisee’s job is to deploy and execute.
So when kiosk performance varies significantly across a portfolio—when location 6 is driving strong check average lift and location 19 is falling short—the instinct is to look at the technology. Same vendor. Same software. Same corporate configuration.
More often than not, the technology isn’t the issue—the execution is.
For multi-unit franchise operators managing 10, 20, or 30-plus locations, execution variance is one of the most underexamined sources of revenue gap in a portfolio. It doesn’t show up as a catastrophic failure. It shows up as check averages that never quite reach their potential, upsell attachment rates that are inconsistent across units, and kiosk adoption numbers that tell very different stories depending on which location you’re looking at.
According to QSR Magazine, nearly 70% of enterprise restaurant brands cite order accuracy as their biggest efficiency challenge—a number that has grown year over year as kiosk deployments have scaled. The brands gaining ground are the ones treating efficient kiosk execution as a strategic priority rather than a day-one deliverable.
Corporate Designs the Experience. The Franchisee Owns the Outcome.
This is the central tension in franchise kiosk deployments, and it’s worth stating plainly.
When corporate works with a kiosk software vendor to engineer the upsell logic, the promotional sequencing, and the menu architecture, they’re building toward a revenue and margin model that assumes consistent execution across the system, where every location is running the same configuration, driving the same attachment rates, and delivering the same check average lift. At least in theory.
That assumption is almost never fully realized in practice. And the franchisee absorbs the gap.
The reasons cluster around three operational realities that don’t get enough attention in conversations about kiosk technology:
- Physical placement
- Menu and configuration accuracy
- Kiosk health
Each one is invisible in aggregate reporting. Each one compounds quietly across a portfolio. And none of them get resolved without the right combination of operational discipline and technology infrastructure.
The Physical Execution Problem
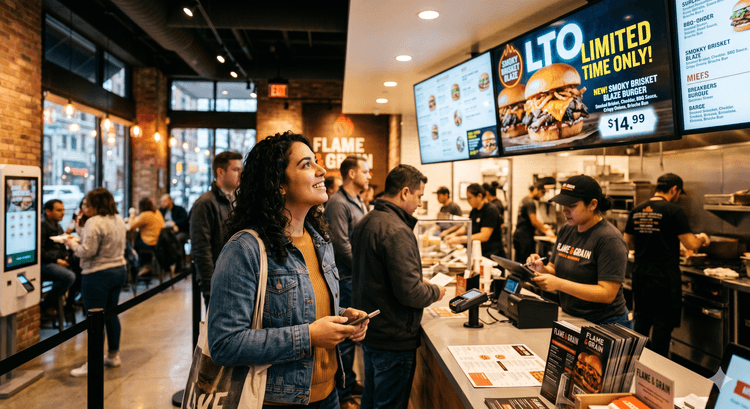
The most overlooked variable in kiosk performance is also the most visible: where the kiosk is, and whether guests know to use it.
A kiosk placed near the entrance, at natural eye level, with clear signage directing guests toward self-order, will drive materially different adoption than a kiosk positioned in a corner of the dining room with no wayfinding. Both units may have identical software configurations. One location’s kiosk is generating transactions throughout the lunch rush. The other is being largely ignored by guests who defaulted to the counter because nothing pointed them elsewhere.
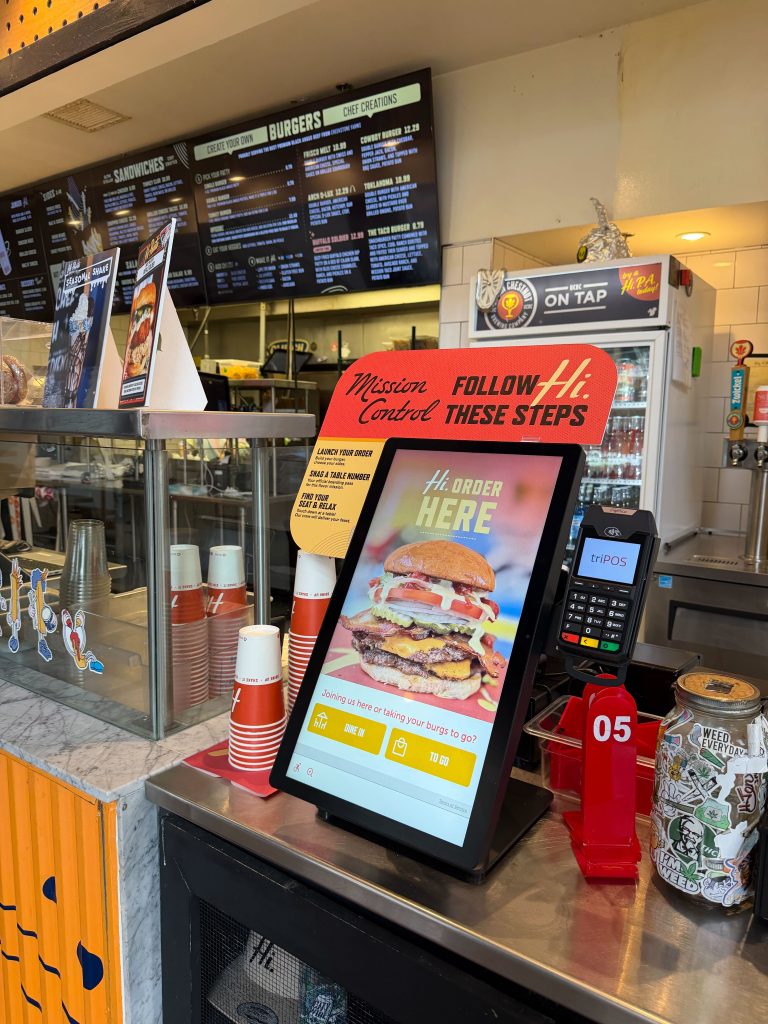
This isn’t a hypothetical. Placement and adoption signage are among the most common differentiators between high-performing and low-performing kiosk locations in a franchise system. A location where staff actively direct guests to the kiosk, where floor signage is current and well-positioned, and where the kiosk is physically integrated into the natural flow of the space will consistently outperform one where the kiosk exists as an afterthought in the layout.
This shows up in adoption rates. And adoption is the prerequisite for everything else the kiosk is supposed to do—the upsell logic, the check average lift, the labor reallocation. None of it matters if guests aren’t using the kiosk in the first place.
Menu & Configuration Accuracy Problem
Even when corporate has worked to ensure upsell logic is done correctly, what’s running at any given unit can diverge from that standard over time.
A menu update rolls out but doesn’t propagate cleanly to every location. An LTO launches and two units in the portfolio are still running the previous promotional sequence. A price adjustment is made at the POS level, but isn’t reflected on the kiosk interface. None of these are dramatic failures, but each one represents a measurable gap between what corporate intended and what the guest actually experiences.
As industry reporting on QSR menu management notes, in multi-unit operations with frequent promotions and regional pricing, manual update processes introduce delays, errors, and configuration drift that compound across locations over time. A single missed update at a handful of units—incorrect pricing during a promotional period, an LTO that launched late—creates brand inconsistency, franchise disputes, and direct margin loss.
The Kiosk Health Problem
There’s a failure mode that’s even more basic than configuration drift—and often just as invisible: the kiosk that’s down, frozen, or underperforming, and nobody knows about it.
QSR Magazine’s coverage of hidden technology costs puts the stakes plainly: when restaurant technology fails, the cost isn’t just in lost transactions, it’s in labor workarounds, damaged guest experience, and brand perception that erodes transaction by transaction. A kiosk that goes offline during the lunch rush, or that appears operational but is frozen on a loading screen, is generating zero revenue while appearing on paper as an active asset.
The problem isn’t always dramatic. A kiosk can be technically powered on but stuck in an incorrect mode. It can be processing orders at a fraction of its typical volume because a connectivity issue is slowing the interface. It can have been quietly switched off by a staff member who found it easier to redirect guests to the counter. In any of these scenarios, the location is underperforming, and without real-time monitoring, no one at the operator or corporate level knows until they look at the end-of-month numbers and see the gap.
For a multi-unit franchisee, the lag between a kiosk going down and someone noticing is a direct revenue leak. Multiply it across a fleet of locations over the course of a year, and the cumulative impact is substantial.
Closing the Gap: What the Right Infrastructure Makes Possible
These three problems—physical placement variance, menu and configuration accuracy, and kiosk health gaps—share a common characteristic: they’re all invisible without the right reporting and monitoring infrastructure in place.
Closing them requires two things to work in parallel: proactive uptime monitoring at the kiosk level, and portfolio-level performance visibility that helps operators and corporate teams see what’s actually happening across the system.
Real-time kiosk monitoring: Bite’s KOR (Kiosk Order Ready) Dashboard
KOR is Bite’s real-time kiosk monitoring system, designed to surface kiosk health issues before they compound into meaningful revenue loss. KOR continuously monitors each kiosk in a fleet for connectivity, operational status, and order flow. When a kiosk goes offline, experiences a hardware issue, or stops accepting orders, KOR immediately sends an alert—via SMS or email—to designated contacts, whether that’s the store manager, a regional operator, or a corporate IT team.
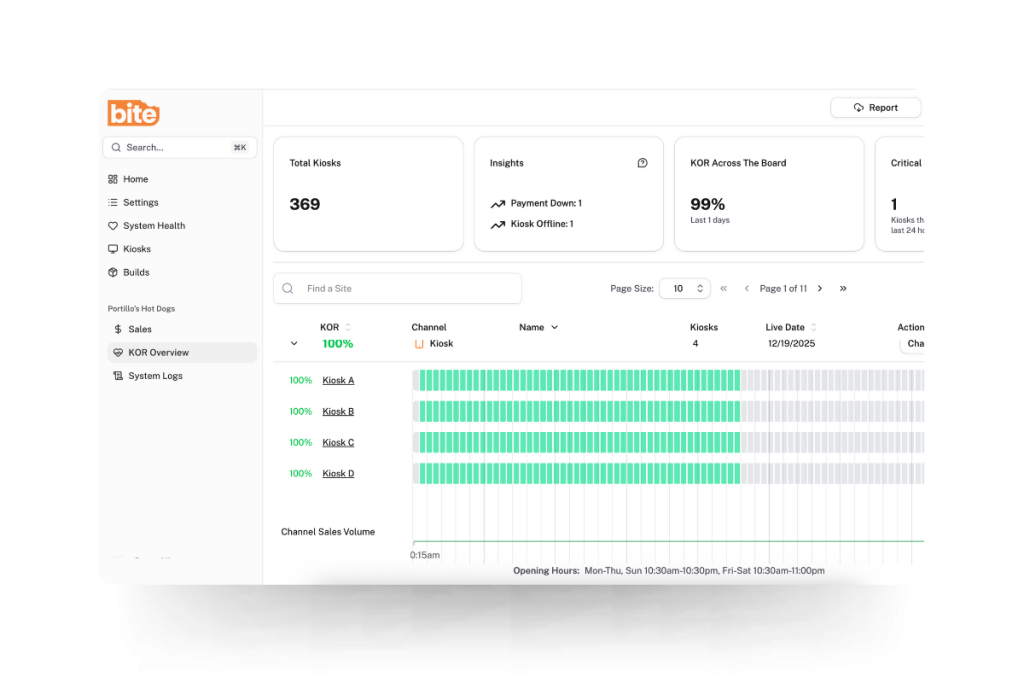
The operational value is straightforward: rather than discovering a kiosk was down for three hours after the fact, operators can act on issues in real time, minimizing downtime and protecting the revenue the kiosk was deployed to generate.
Portfolio-level visibility: Bite’s Sales & Analytics Dashboard
Uptime monitoring addresses acute issues. Portfolio-level reporting addresses the chronic ones—the performance variance that accumulates quietly across locations over weeks and months.
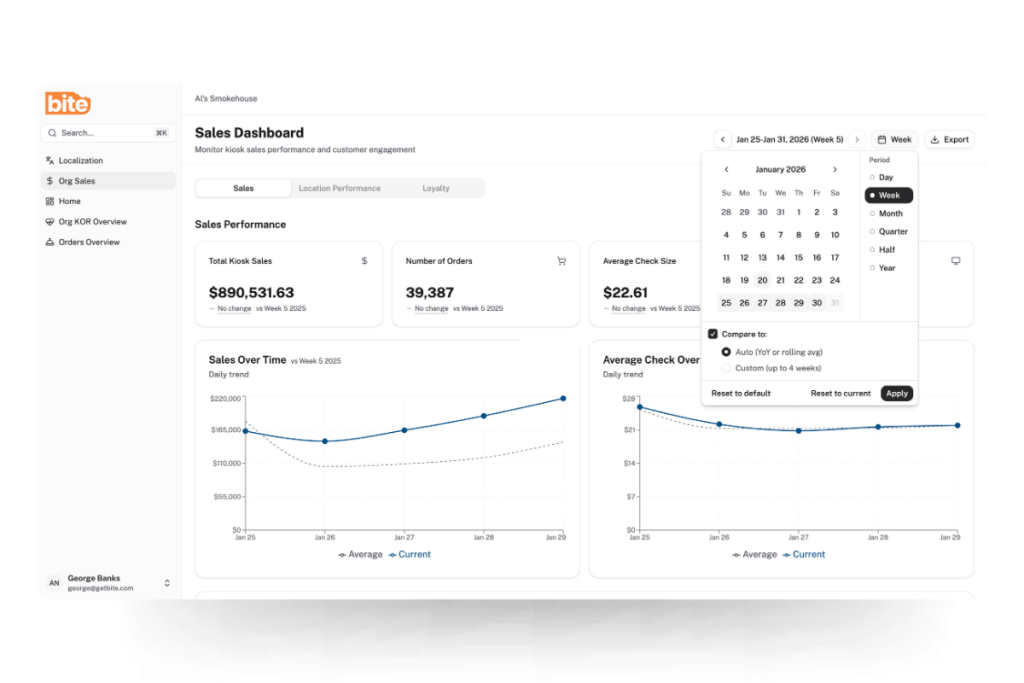
Bite’s Sales & Analytics Dashboard gives both corporate teams and individual franchise operators a clear view of what’s actually happening across kiosk-enabled locations. Corporate sees the full system—total sales, average check sizes, order volume, and location-level performance across the entire footprint. Individual franchisees see the same depth of insight scoped to their own units.
The features that matter most for closing execution gaps:
Location-level comparison. The dashboard makes it straightforward to identify top-performing locations and understand what’s driving their results—and to flag underperforming locations that may need operational attention. A location consistently running below system average on check size or attachment rate is a signal worth investigating. Is it a placement issue? A configuration gap? A staffing behavior driving guests to the counter? The data surfaces the question; the operator can then go find the answer.
Hour-by-hour order trends. Breaking down order volume by hour gives operators the data to optimize staffing and identify peak-period performance gaps. A kiosk that should be driving strong lunch volume but shows a mid-shift drop-off may have experienced an issue KOR already flagged—or it may reflect a staffing or placement dynamic that requires a different kind of intervention.
Promotional and LTO performance tracking. Filtering by date range allows operators to evaluate kiosk performance during specific promotional periods, seasonal peaks, or new menu rollouts—and to compare current performance against any historical period to identify whether configuration changes are having the intended effect.
Loyalty program metrics. For brands leveraging loyalty through their kiosks, the dashboard surfaces loyalty penetration rates, average check uplift from loyalty members, and revenue opportunity forecasting based on increasing loyalty adoption. This gives operators a quantified view of the ROI their loyalty program is generating at the kiosk level.
Together, KOR and the Sales & Analytics Dashboard address both ends of the execution gap problem: the acute issues that need immediate response, and the chronic variance that requires systematic visibility to diagnose and close.
What the Data Makes Visible
Consider what changes for a regional franchisee operating 20 locations when this infrastructure is in place.
Location 14 shows up in the dashboard as consistently below the system average on average check size. KOR has logged two brief outage events in the past month, both resolved within minutes of the alert. But the check average gap persists even when the kiosk is fully operational, which points toward a placement or adoption issue rather than a technical one. The operator visits the unit and finds the kiosk tucked against a side wall with no directional signage, while guests queue at the counter out of habit.
That diagnosis—and the fix—would have been invisible without portfolio-level reporting. The location would have continued to underperform, the revenue gap would have continued to compound, and the cause would have remained unknown until someone happened to notice it on a site visit.
This is what the right technology infrastructure makes possible. Not just kiosks that take orders, but visibility that allows operators and corporate teams to ensure those kiosks are performing as the system was designed to perform.
The Rollout Is the Beginning, Not the End
For franchise operators in QSR and fast casual, the kiosk is increasingly a baseline expectation—from corporate, from guests, and from the competitive landscape. What differentiates operators going forward isn’t whether they have kiosks. It’s whether those kiosks are performing consistently across every unit in the portfolio.
The gap between a well-executing kiosk deployment and an average one isn’t usually a technology gap. It’s a placement gap, a configuration gap, a health monitoring gap, and a visibility gap. Closing all four is what turns a kiosk rollout from a capital line item into a sustained margin driver.
Bite’s platform is built to support that full lifecycle—from real-time kiosk monitoring to portfolio-level performance visibility. If you’re ready to see what consistent, system-wide kiosk performance looks like in practice, request a demo today.