

Somewhere this month, in a conference room or a Zoom window, 2027 budget discussions will commence, and the first thought is to look at 2026’s budget as a starting point. But there are other places to look.
The numbers that will decide what your 2027 technology budget can actually do are already published. Some of them were certified by a state agency in July. Others sit in a USDA table that updates on the 25th of every month. None of them require a forecast, a consultant, or a crystal ball. And once you account for them, the discretionary portion of that budget turns out to be a lot smaller than the line item everyone is staring at.
Start with the ceiling, not the wish list
Restaurant IT budgets now average 2.58 percent of revenue, according to Hospitality Technology’s 2026 Restaurant Technology Study. That figure gets quoted a lot, usually as evidence that the industry is finally taking technology seriously.
The more useful number is buried right next to it. Sixty-six percent of that spend goes to maintaining solutions that already exist.
Run the math. On a twenty-unit portfolio doing $2.5 million per store, 2.58 percent of revenue is about $1.29 million in annual technology budget. Two-thirds of that is committed before the planning meeting starts. What’s actually available for anything new is closer to $440,000, or roughly nine-tenths of one percent of revenue.
That’s the real number. Every vendor conversation you have between now and December is competing for a slice of nine-tenths of a percent.
Three numbers you can write down today
The cost pressures shaping next year’s P&L aren’t a mystery, and they aren’t evenly distributed. Three of them are specific enough to put in a model right now.
Food. The USDA’s Economic Research Service projects food-away-from-home prices rising 2.7 percent in 2027, with all food up 2.4 percent. The pressure underneath that average is concentrated: beef and veal are running up 9.8 percent this year, and wholesale beef 9.4 percent. If protein is a meaningful share of your menu mix, your 2027 food cost line moves well ahead of the headline number.
Labor. California’s minimum wage rises to $17.40 on January 1, 2027, after the Department of Finance certified a 2.99 percent CPI adjustment in July. The state’s fast food minimum holds at $20. Most other indexed states will publish their January adjustments over the next several weeks, and if you operate across state lines, those dates are worth a calendar entry rather than a surprise.
Wage drift everywhere else. Private-industry wages rose 3.1 percent for the twelve months ending June 2026, per the Bureau of Labor Statistics Employment Cost Index. That’s the number that moves your shift leads and general managers, the roles no minimum wage schedule touches.
None of these are things to hedge against. They’re line items. You can put them in a spreadsheet this afternoon.
The margin you’re budgeting against
Here is the context that makes the budget conversation hard. The National Restaurant Association’s 2026 State of the Restaurant Industry found that 42 percent of operators reported their restaurant was not profitable last year. Industry sales are projected at $1.55 trillion with 1.3 percent real growth.
Growth of 1.3 percent does not absorb food costs, up 2.7 percent, and wages up 3.1 percent. The gap has to come from somewhere, and for most portfolios it comes from throughput, check average, or waste.
Which means the technology budget stops being defended on roadmap and starts being defended on return. Nobody is approving a platform because it’s modern.
What most portfolios haven’t priced
There’s one more thing sitting in the 2027 budget that a lot of operators haven’t fully accounted for. Forty-four percent of operators plan to replace or significantly upgrade their POS, according to Hospitality Technology’s 2026 POS Software Trends Study.
For a lot of multi-unit operators, both of those decisions land in the same budget year, pulling from the same small pot. And they’re tangled together. The reason two-thirds of the budget goes to upkeep is that most operators bought their systems one at a time and figured out how to connect them later.
So the order you do things in matters more than what you buy. Before you commit to anything customers touch, you need to know where the POS is headed. If the plan is to sort out the connections afterward, that’s how the upkeep line gets to two-thirds in the first place.
What clears approval
The requests that get funded and the requests that get deferred tend to differ in one specific way. The funded ones show a payback the finance team can verify inside the fiscal year, using the operator’s own transaction data rather than a vendor’s blended average.
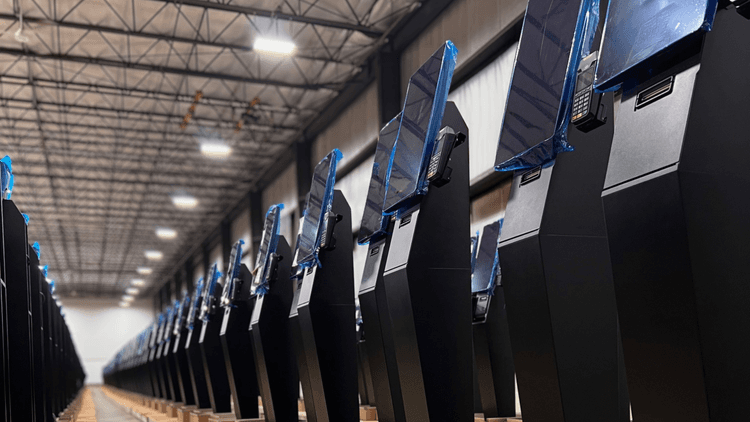
For self-order kiosks, two lines carry that argument, and both are auditable against a POS export. The first is check average on kiosk orders versus employee-taken orders in the same store and same daypart. The second is order accuracy, which shows up as comps and refunds and is usually undercounted because nobody assigns it a dollar figure.
Build from the floor up
The instinct in September is to open last year’s budget and work down from it. The better exercise is to build from the cost floor up: write down the three inputs you already know, subtract the maintenance commitment, and see what’s genuinely left.
Then ask the only question that survives that exercise. Of everything on the list, which single investment pays back before the fiscal year closes?